The Mixed Methods Blog

Perspectives from our researchers, highlights from recent studies, and other news about CCRC

More Clues From the Great Recession: How Will COVID-19 Affect Community College Funding?

funding-coronavirus

In the latest installment of our COVID-19 blog series, Davis Jenkins, John Fink, and Thomas Brock use Great Recession-era data as a potential blueprint for how community college funding may shift moving forward.

How Will COVID-19 Affect Community College Enrollment? Looking to the Great Recession for Clues

How Will COVID-19 Affect Community College Enrollment? Looking to the Great Recession for Clues

Based on observations following the last major disruption to community colleges, Davis Jenkins and John Fink explore how the COVID-19 pandemic could affect enrollment trends across three groups of students: students aged 25 and over, students aged 18–24, and dual enrollment students.

Shifting Sectors: How a Commonly Used Federal Datapoint Undercounts Over a Million Community College Students

Shifting Sectors: How a Commonly Used Federal Datapoint Undercounts Over a Million Community College Students

The IPEDS definition of public-two year colleges no longer fits the community college sector and its students, making it more challenging for policy research to provide an accurate statistical picture of these institutions. In this blog post, John Fink and Davis Jenkins describe CCRC's alternative definition.

John Fink Honored as a Transfer Champion by NISTS

John-Fink-Blog-Post-Image

The National Institute for the Study of Transfer Students will honor CCRC Senior Research Associate John Fink with its 2019 Champion–Catalyst award, which recognizes "game-changers in the transfer field."

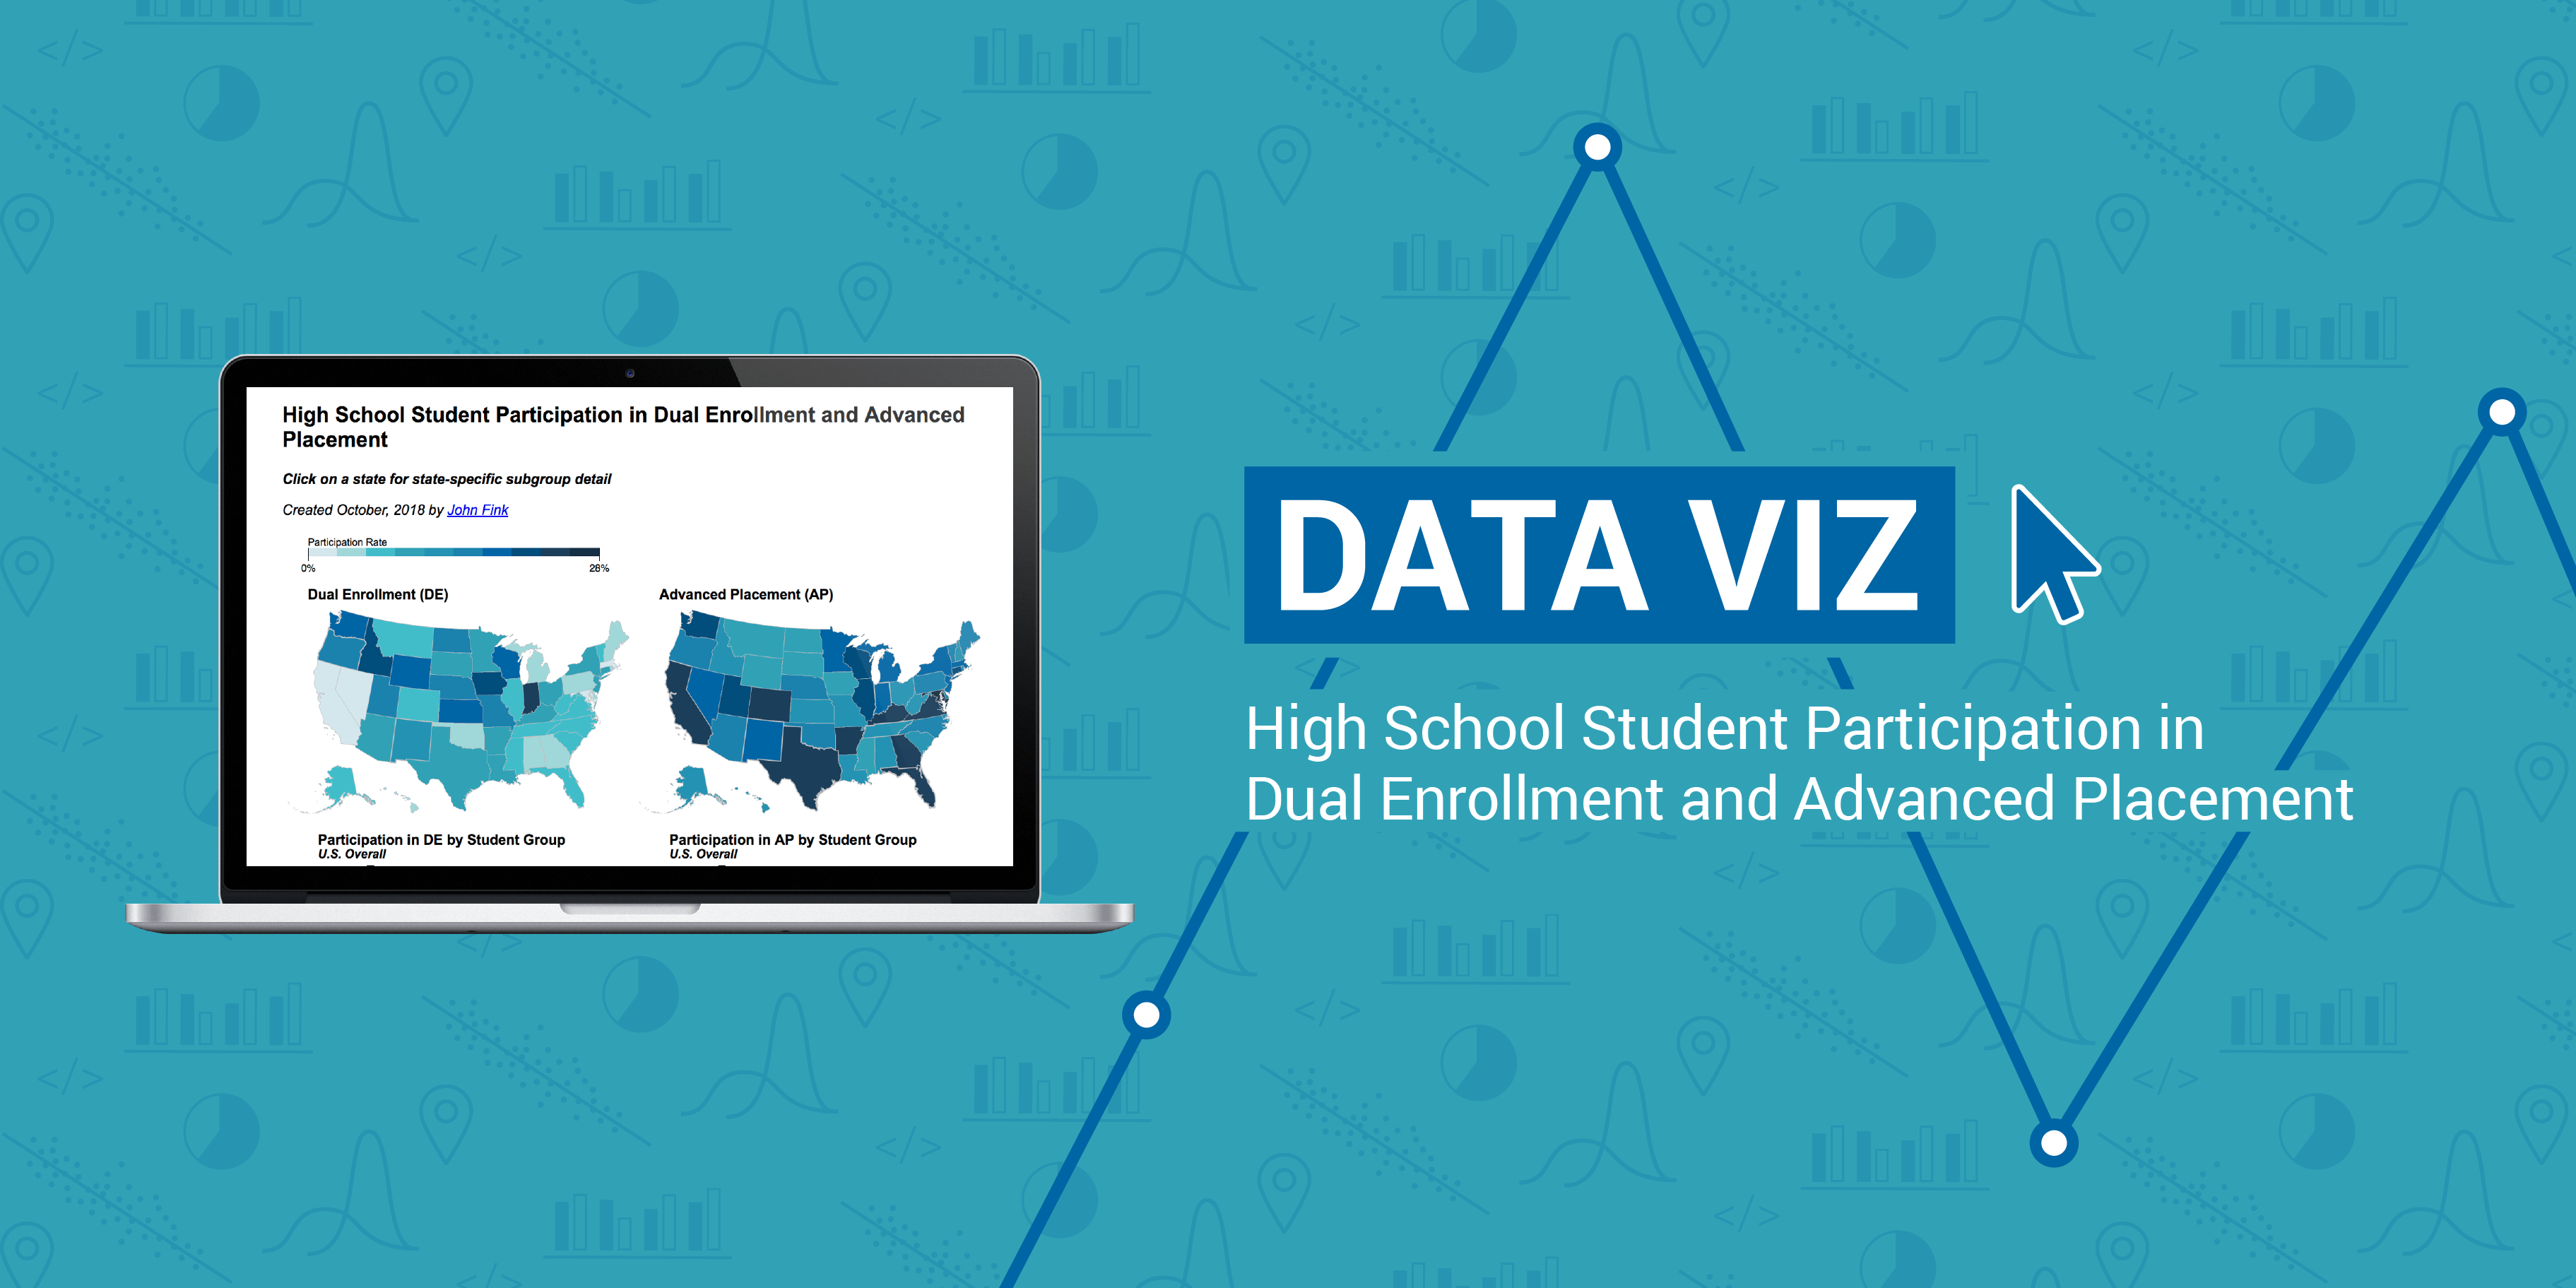
How Does Access to Dual Enrollment and Advanced Placement Vary by Race and Gender Across States?

data-viz-access-dual-enrollmen_20181102-192320_1-1

John Fink uses newly released data from the U.S. Department of Education's Office for Civil Rights to look at disparities in access to dual enrollment and Advanced Placement by race and gender. An interactive data visualization shows the breakdown of participation by race and gender in each state.