

Last week, the U.S. Department of Education released new data that, for the first time ever, provide college-level counts of the number of high school dual enrollment students, disaggregated by race/ethnicity and gender. The provisional release of these new data represents years of effort among dozens of organizations pushing for better dual enrollment data. In this post, I detail a first look at this new information.
According to the new IPEDS data, nearly 2.5 million high school students took at least one dual enrollment course from a college or university in the 2022-23 academic year. This is much higher than our previous estimate of 1.5 million using student age (under 18) for fall 2021 enrollment alone, which makes sense given that high school students take dual enrollment courses in the spring. Readers should interpret these new numbers with caution, however, since this is the first time colleges have reported dual enrollment counts for IPEDS. Since the analysis here uses provisional-release data from new IPEDS survey components (and dual enrollment is notoriously challenging to define consistently across state and local contexts), if you spot any potentially spurious data points, we encourage you to investigate internally and make corrections if needed to your IPEDS submissions.
What is the size and significance of dual enrollment across postsecondary sectors and states?
Nationally, community colleges enrolled the majority of high school dual enrollment students, followed by public four-year and private nonprofit four-year colleges. For community colleges, the 1.78 million high school dual enrollment students represented 21% of total enrollments during the 2022-23 year (8.6 million in total). Two hundred forty thousand high school students took dual enrollment at the 10 largest dual enrollment colleges alone, and of these top 10, eight were community colleges.
As shown below, the size of high school dual enrollment at community colleges differed substantially across states. For example, in Idaho and Indiana, high schoolers represented the majority of community college enrollments in 2022-23, and in eight other states dual enrollment made up a third or more of total community college enrollment. At 37 community colleges across the country, 50% or more of enrollment was from high school dual enrollment.
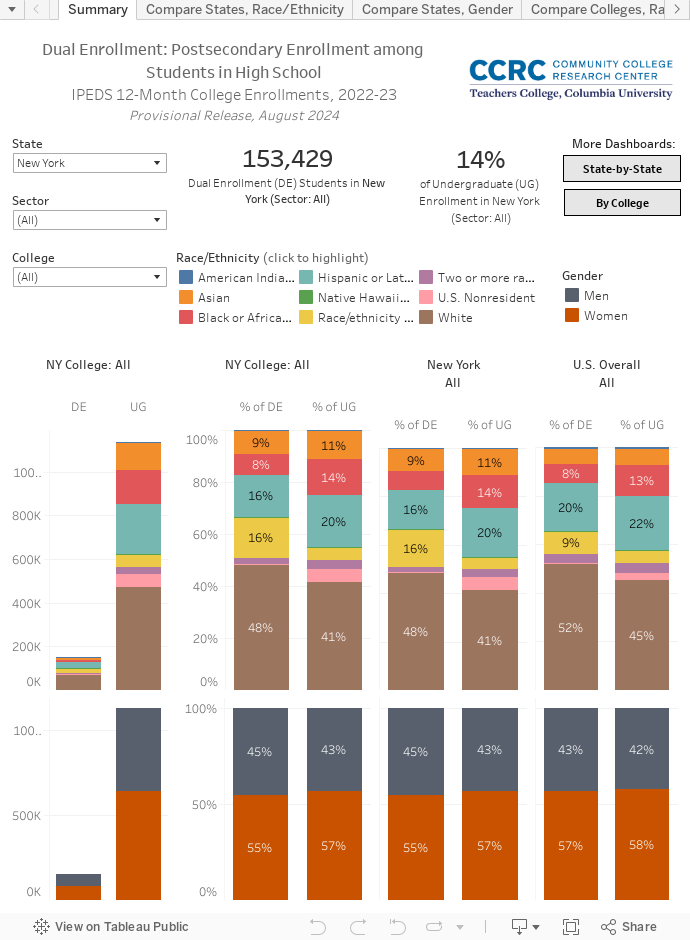
Compared to undergraduate students overall, how representative are dual enrollment students by race/ethnicity and gender?
Compared to undergraduates overall, Black and Hispanic students were underrepresented nationally in dual enrollment during 2022-23, echoing our previous analysis of national K-12 data. White students were overrepresented in dual enrollment, accounting for 52% of high school dual enrollment compared to 45% of undergraduate enrollment overall (and 44% of K-12 enrollment).
Black students, which made up 13% of undergraduate enrollment and 15% of public K-12 enrollment, comprised only 8% of high school dual enrollment. Black students were underrepresented in dual enrollment in every state except for Massachusetts. And Black students had equal or greater representation in dual enrollment at only 74 community colleges—fewer than one in ten community colleges serving dual enrollment students nationally.
Hispanic/Latino students made up 22% of undergraduate enrollment (and 29% of public K-12 enrollment) but only 20% of high school dual enrollment. Hispanic/Latino students had greater or equal representation in dual enrollment in 18 states and at more than a third of community colleges nationally.
One caveat is that, nationally, more dual enrollment students were reported with unknown race/ethnicity (9%) compared to undergraduates overall (5%), muddying the picture somewhat. Similar to undergraduates overall, men were underrepresented among dual enrollment students nationally (43%).
In the dashboard below, you can select your college or your state and identify the number of dual enrollment students, consider the size of dual enrollment as a percentage of overall undergraduate enrollment, and compare the racial/ethnic and gender representation of dual enrollment students to that of undergraduate enrollments overall.
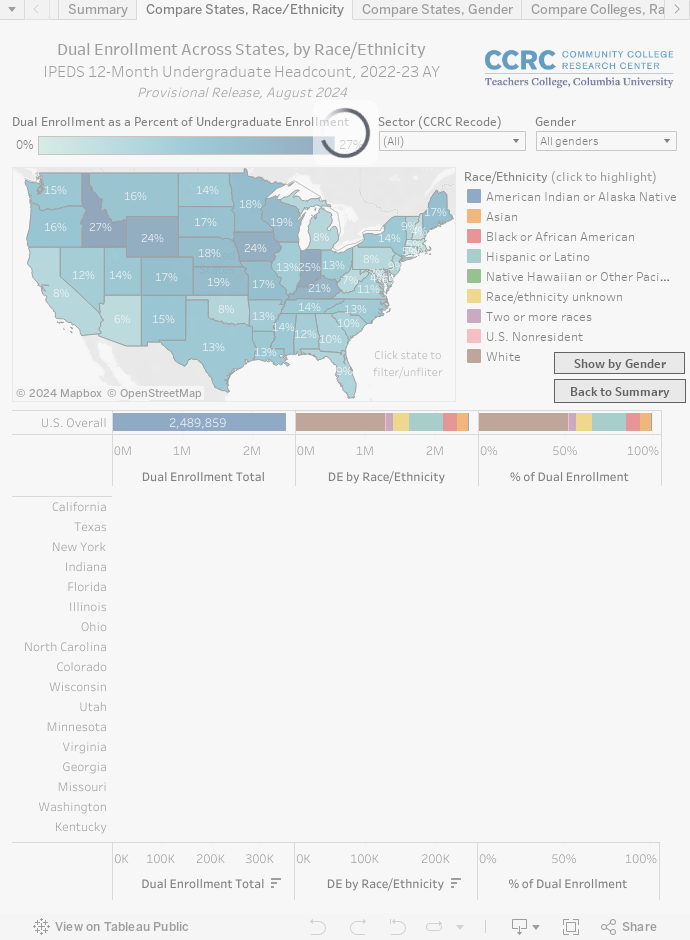
How does your state compare to others in dual enrollment size and representation?
The top five states for dual enrollment by size—California, Texas, New York, Indiana, and Florida—together reported nearly 900,000 dual enrollments, about a third of dual enrollment nationally. California, Texas, and Florida enrolled the largest numbers of Hispanic or Latino dual enrollment students, and Texas, Florida, and Georgia enrolled the largest numbers of Black dual enrollment students.
In the dashboard below, you can look across states to compare the percentage of dual enrollment as a share of overall undergraduate enrollment (shown in the map), see states ranked in order of the number of high schoolers enrolled in dual enrollment, and compare racial/ethnic composition of dual enrollment across states and to the U.S. overall.
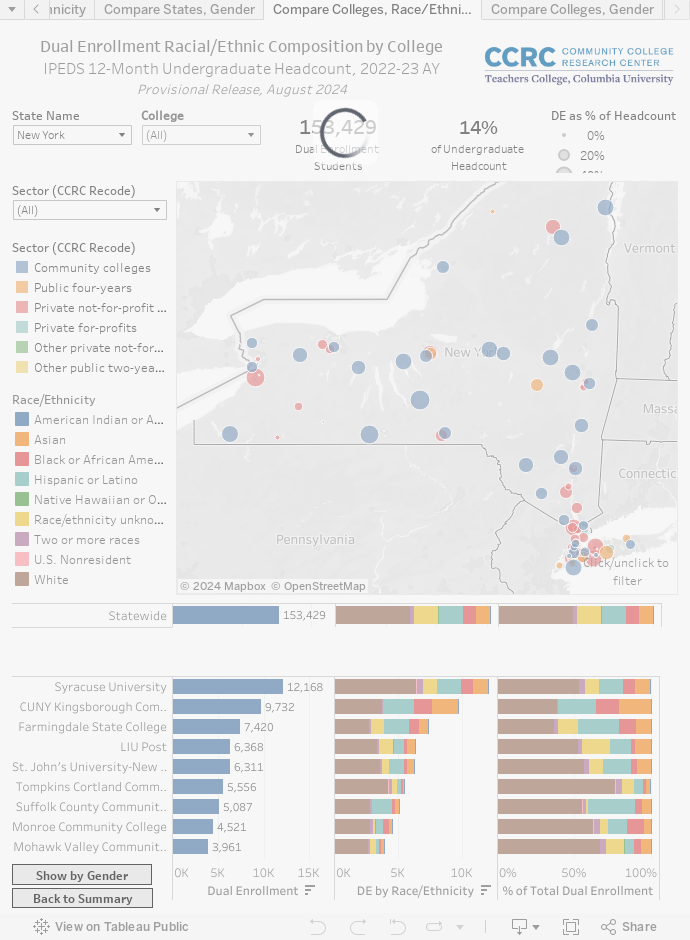
How does participation in dual enrollment vary among colleges in your state?
In the dashboard below, you can look within your state to compare the size and demographic breakdown of dual enrollment students across colleges. Select your state to view all of the postsecondary institutions, the size of their dual enrollment programs, the significance of dual enrollment as a share of their undergraduate headcount, and dual enrollment counts disaggregated by race/ethnicity and gender.
Implications of the new data
Given decades of research documenting the positive benefits of participating in dual enrollment coursework on high school and postsecondary outcomes, the growth of these programs has great potential to expand college and career opportunity for high school students across the country. And yet gaps in access to dual enrollment for Black, Hispanic, low-income, and other underserved groups persist in preventing these programs from fully realizing their potential. But, as we have learned in our dual enrollment equity pathways research, it is not only possible to broaden the benefits of dual enrollment but also increasingly important for college business models to rethink the conventional approach, sometimes described as “programs of privilege” or “random acts” of dual enrollment. These new data can help to motivate and guide reform efforts by providing public, college- and state-level, disaggregated data for practitioners and policymakers seeking to rethink dual enrollment as a more equitable and effective on-ramp to career-path postsecondary education for students.