

Last year, Davis Jenkins and I released a report showing that too few students who start at a community college are able to transfer and complete a bachelor’s degree. We tracked a cohort of about 720,000 entering, degree-seeking community college students and found that only about 100,000, or 14 percent, completed a bachelor’s degree within six years. Transfer research by CCRC and others, including work on bachelor’s-aspiring community college entrants, institutional transfer performance, two- and four-year college partnerships, and credit-transfer efficiency, is shedding more light on why so few community college entrants transfer and complete bachelor’s degrees.
One of the main takeaways from our work with our partners at the National Student Clearinghouse Research Center, the Aspen Institute, and Public Agenda is that the pathways transfer students follow are often long and complicated. This is true even for students who succeed in completing a bachelor’s degree. Simply examining the sequences of enrollments at different types of colleges in the six years after students entered college demonstrates the complexity of transfer student pathways.
I’ve presented the slide below a few times at conferences, and it consistently surprises audiences. Many think of community college transfer in terms of “2 + 2”: A student spends two years at the community college and two years at the four-year college, and earns a bachelor’s.
In fact, as the slide shows, only 8% of bachelor’s degree graduates who started at a community college in 2007 followed the 2 + 2 pattern. When students were tracked over six years, 2 + 3, 3 + 3, and 2 + 4 patterns were slightly more common, though no one pattern applied to a majority of transfer students. Interestingly, about one in five students “stopped out” for a year or more, reenrolled, and subsequently completed a bachelor’s.
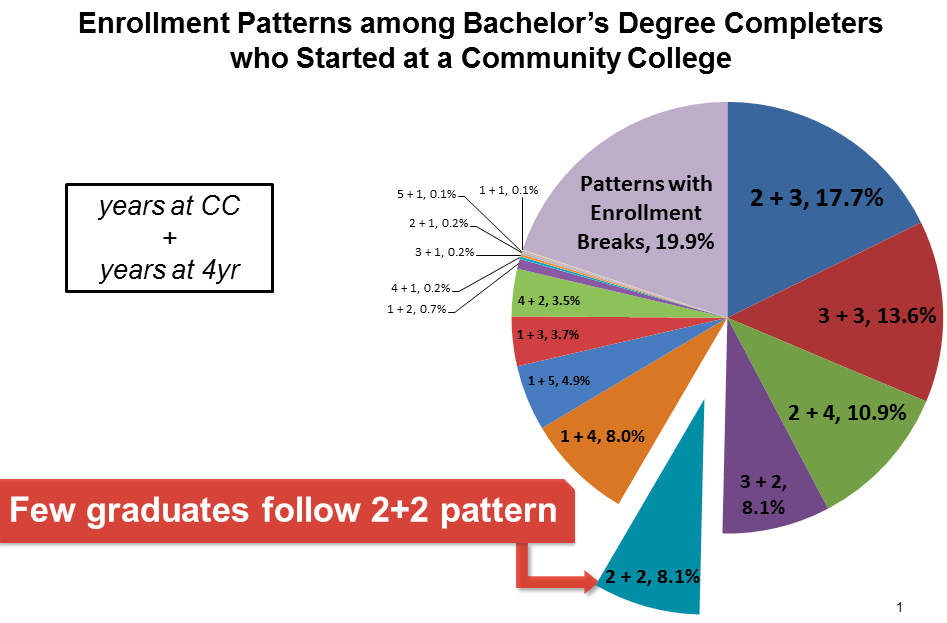
Note. Percentages based on National Student Clearinghouse data on students who completed a bachelor’s degree within six years of entering a community college in the fall of 2007. See Jenkins and Fink (2016) for more information on data and definitions. Sequences were derived using term-by-term enrollment data on whether students were enrolled at a two-year college, enrolled at a four-year college, or not enrolled. We collapsed term-by-term data into year-by-year results using students’ highest institution attended for each year. For example, a student’s second year would be categorized as ‘four-year college’ if during their second year that student enrolled at a two-year institution in the fall, transferred mid-year, and enrolled at a four-year institution in the spring.
The interactive tool below allows us to slice up the data even more finely and follow different student transfer paths. It shows the various sequences of college enrollment followed by the roughly 100,000 students in our dataset who started at a community college in fall 2007, transferred, and completed a bachelor’s degree within six years. Hover over the chart to explore the myriad enrollment sequences transfer students followed.
Enrollment Patterns Among Transfer Students Who Earned a Bachelor’s in Six Years (N = 99,727)
of transfer students who completed a bachelor’s degree followed this sequence
To learn more about essential practices of highly effective two- and four-year colleges partnering to support transfer success, see The Transfer Playbook.