

By John Fink and Davis Jenkins
What programs are community college students completing, what do they lead to, and which groups of students are underrepresented in programs leading to stronger postgraduation outcomes? To answer these questions—and help community colleges ensure that their programs are worth students’ time and resources to complete—we created a dashboard using IPEDS data to show which credentials students are completing at each college and state, disaggregated by race/ethnicity and gender.
We’ve recently updated the dashboard with program-level earnings data from the U.S. Department of Education’s College Scorecard to offer additional insight into where programs lead. And by disaggregating results by race/ethnicity and gender, the dashboard can help colleges identify inequitable representation in programs that may have greater value in the labor market. (The dashboard provides the same information for graduates of public four-year institutions.)
Find your college’s data: Explore College Completions by Program with Associated Earnings
For example, the screenshot below of the “Awards by Program” tab shows the award level (short certificate, long certificate, associate degree, etc.) and program area of the nearly 1.5 million credentials awarded by community colleges nationally in 2019–20 (the latest data available). Nearly 250,000, or 17%, of awards were in liberal arts and sciences/liberal studies—the largest share of any program. Four percent of community college awards were associate degrees in nursing, and 3% were associate degrees in business administration. The median earnings two years postgraduation for students across these programs—shown as you hover over each—are starkly different, with nurses earning nearly twice as much as business graduates.
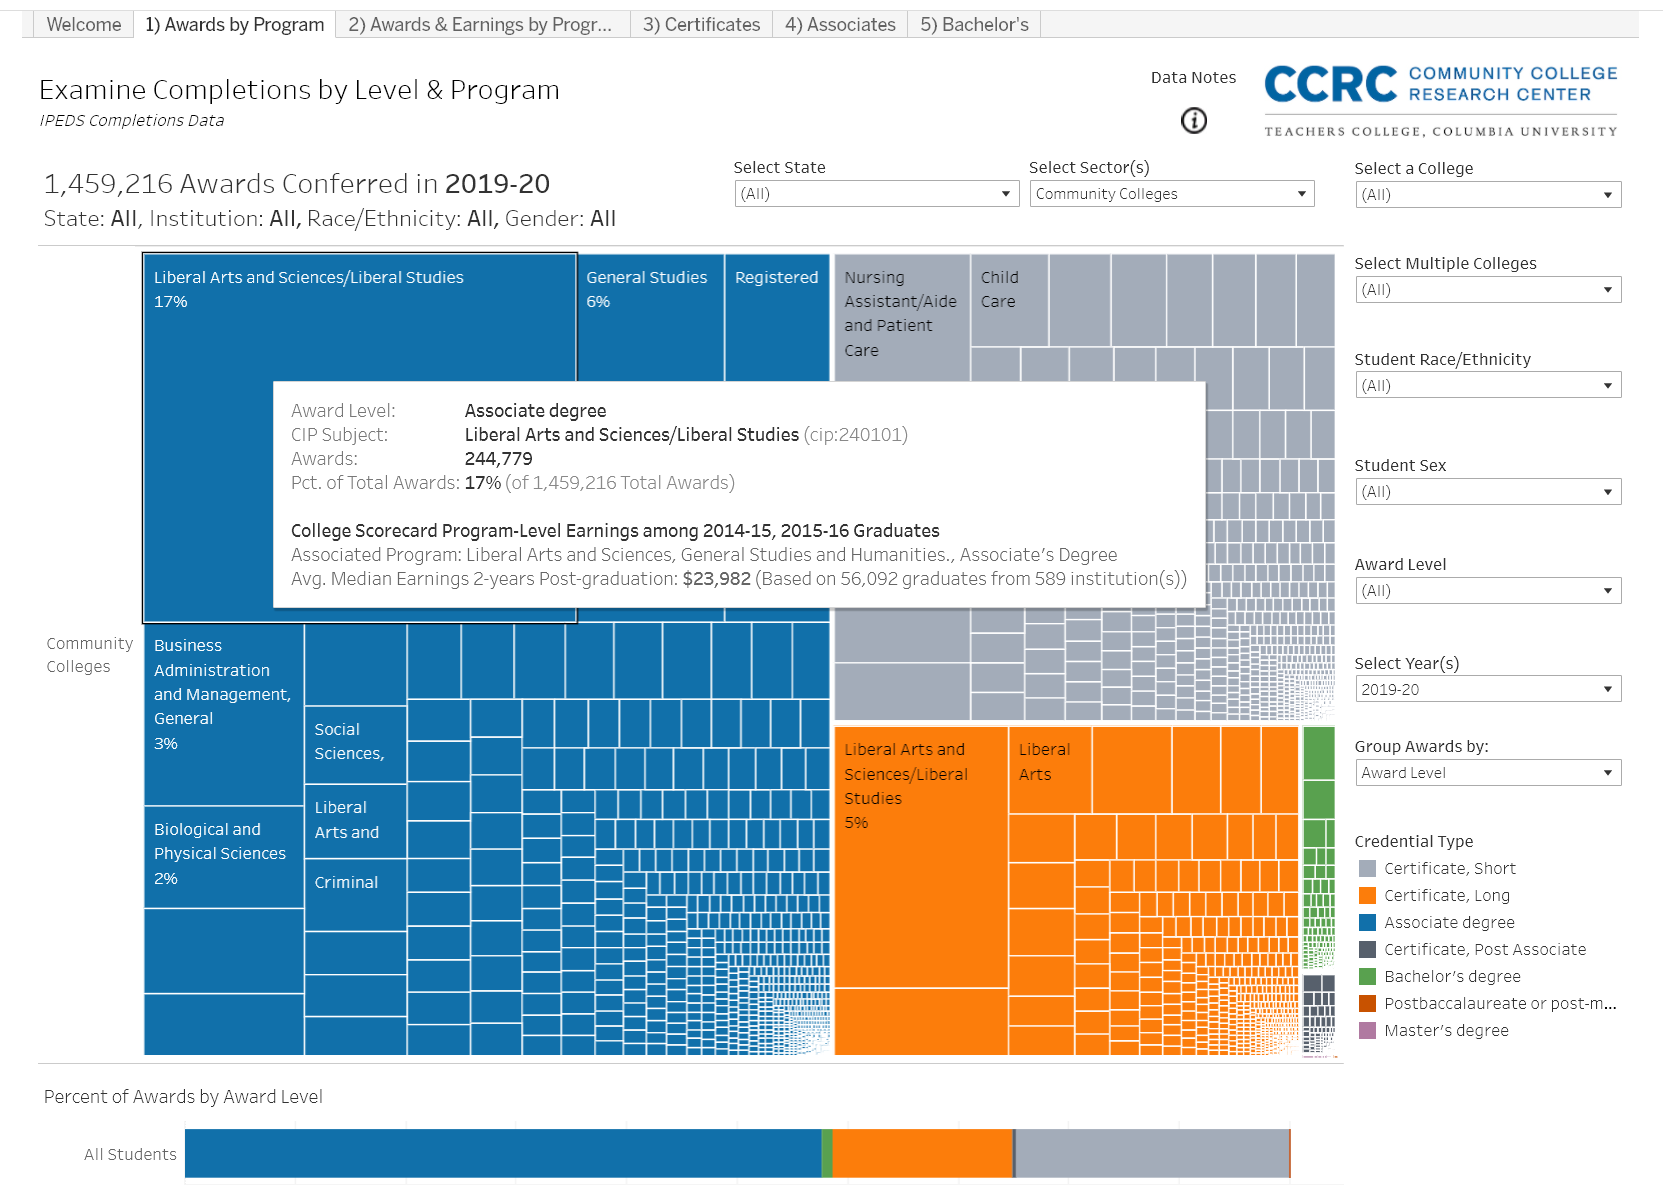
Award data are from IPEDS. Earnings data were compiled from the College Scorecard by Michael Itzkowitz and colleagues at Third Way based on median earnings (reported in 2019 U.S. dollars) two years postgraduation among students who completed a credential in 2014–15 and 2015–16, were working, and were not enrolled in college. We merged these data with the latest IPEDS Completions survey data (2019–20) for each institution, credential type, and 4-digit program CIP code.
In interpreting these data for your own college or state’s programs, you should keep in mind two caveats. First, at the program level, there are many cases where earnings data are missing. Thus, colleges would need to consult other labor market data on the earnings of graduates from programs classified as “Missing.”
Second, earnings among graduates of transfer programs—measured two-years after graduation for students who are no longer enrolled at any postsecondary institution—mainly represent earnings among students who did not transfer. In many respects, the value of a transfer program depends on how well it prepares students to transfer and complete a bachelor’s degree. So, while other measures—such as rates of transfer and bachelor’s completion—are more appropriate measures of transfer program value, these data demonstrate the stakes for improving transfer outcomes by showing the large number of students who completed a transfer program, likely did not transfer, and instead were working for low wages.
The dashboard also allows you to group awards by earnings two years post-completion. As seen in the screenshot below, the “Awards & Earnings by Program” tab shows awards by credential type and program area organized into thirds by median earnings two years after graduation. (Awards for which program-level earnings data are missing are shown in the bottom bar.)
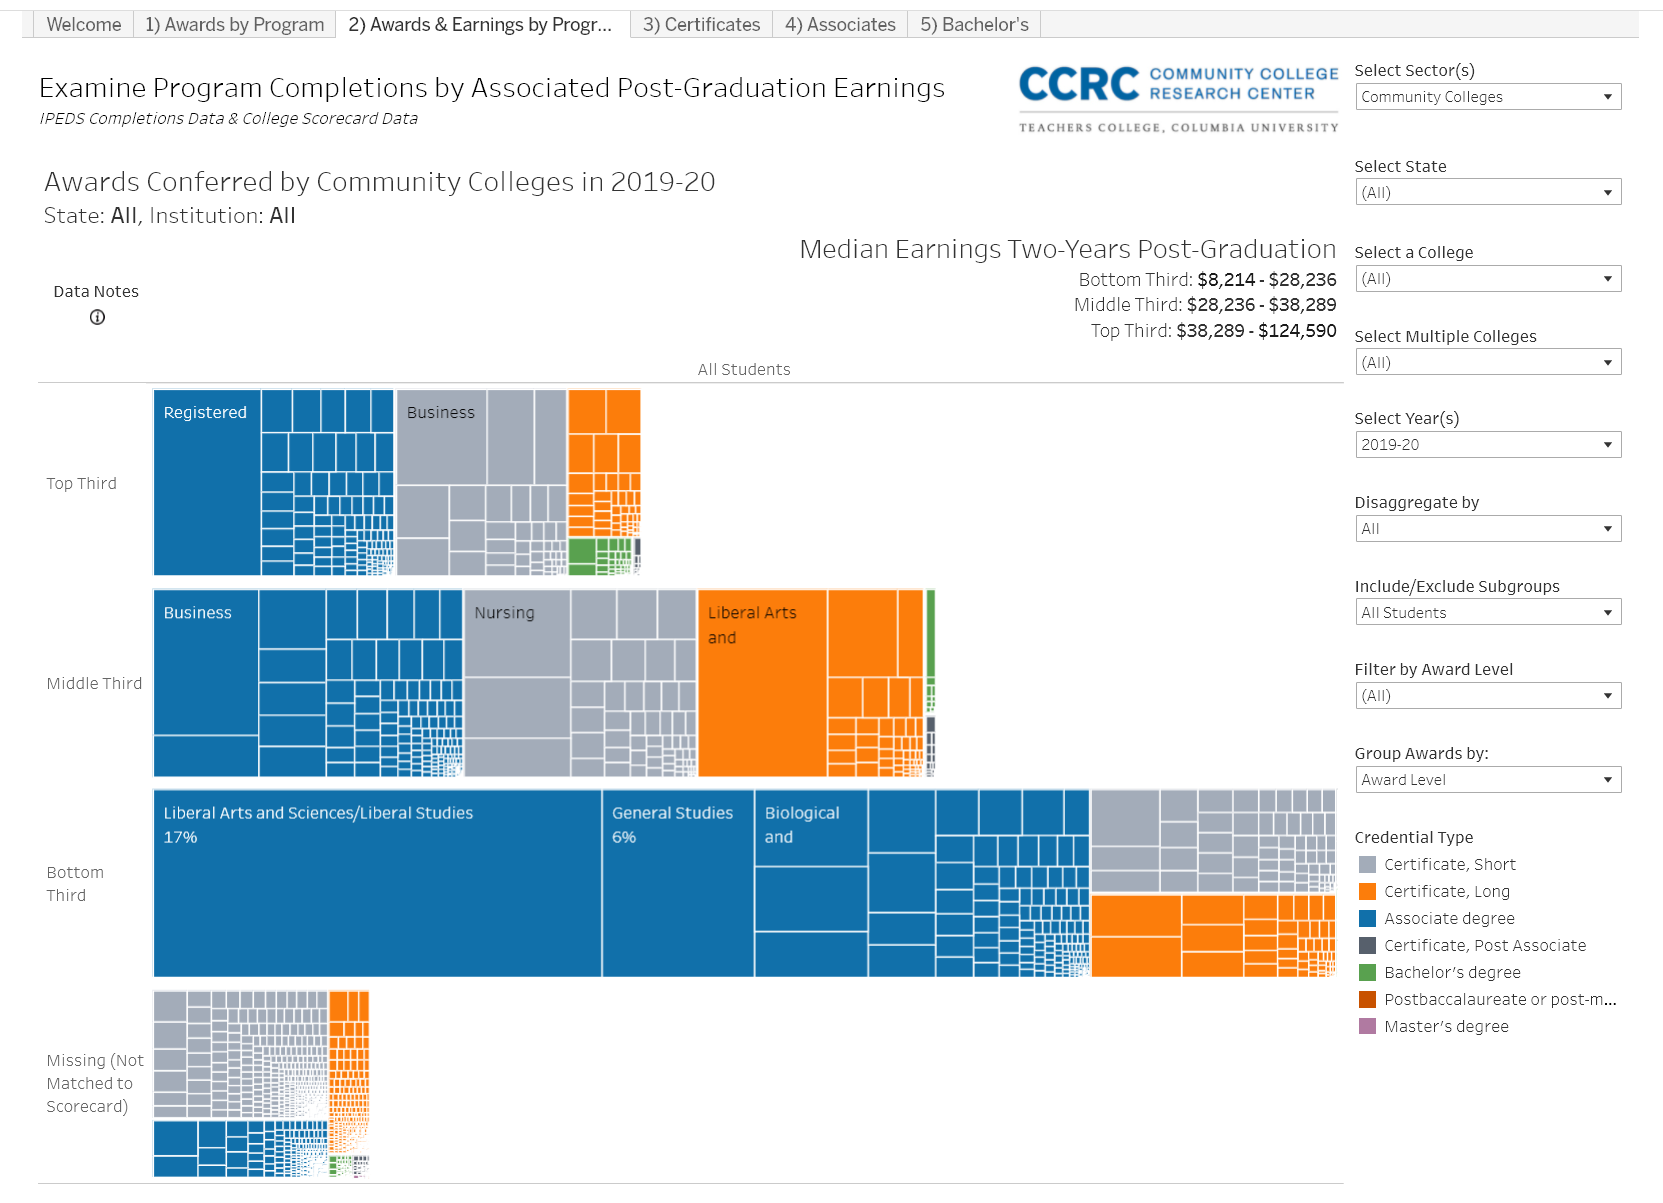
Groupings by earnings refresh for each college or set of colleges selected using the dashboard’s filters. For example, if you select a specific college, the groupings will reflect the College Scorecard median earnings data for that institution. When multiple institutions are selected, the dashboard groups programs based on average median earnings among those institutions. Filtering the data for a state shows the average median earnings among graduates of particular programs in the state for which College Scorecard earnings data are available.
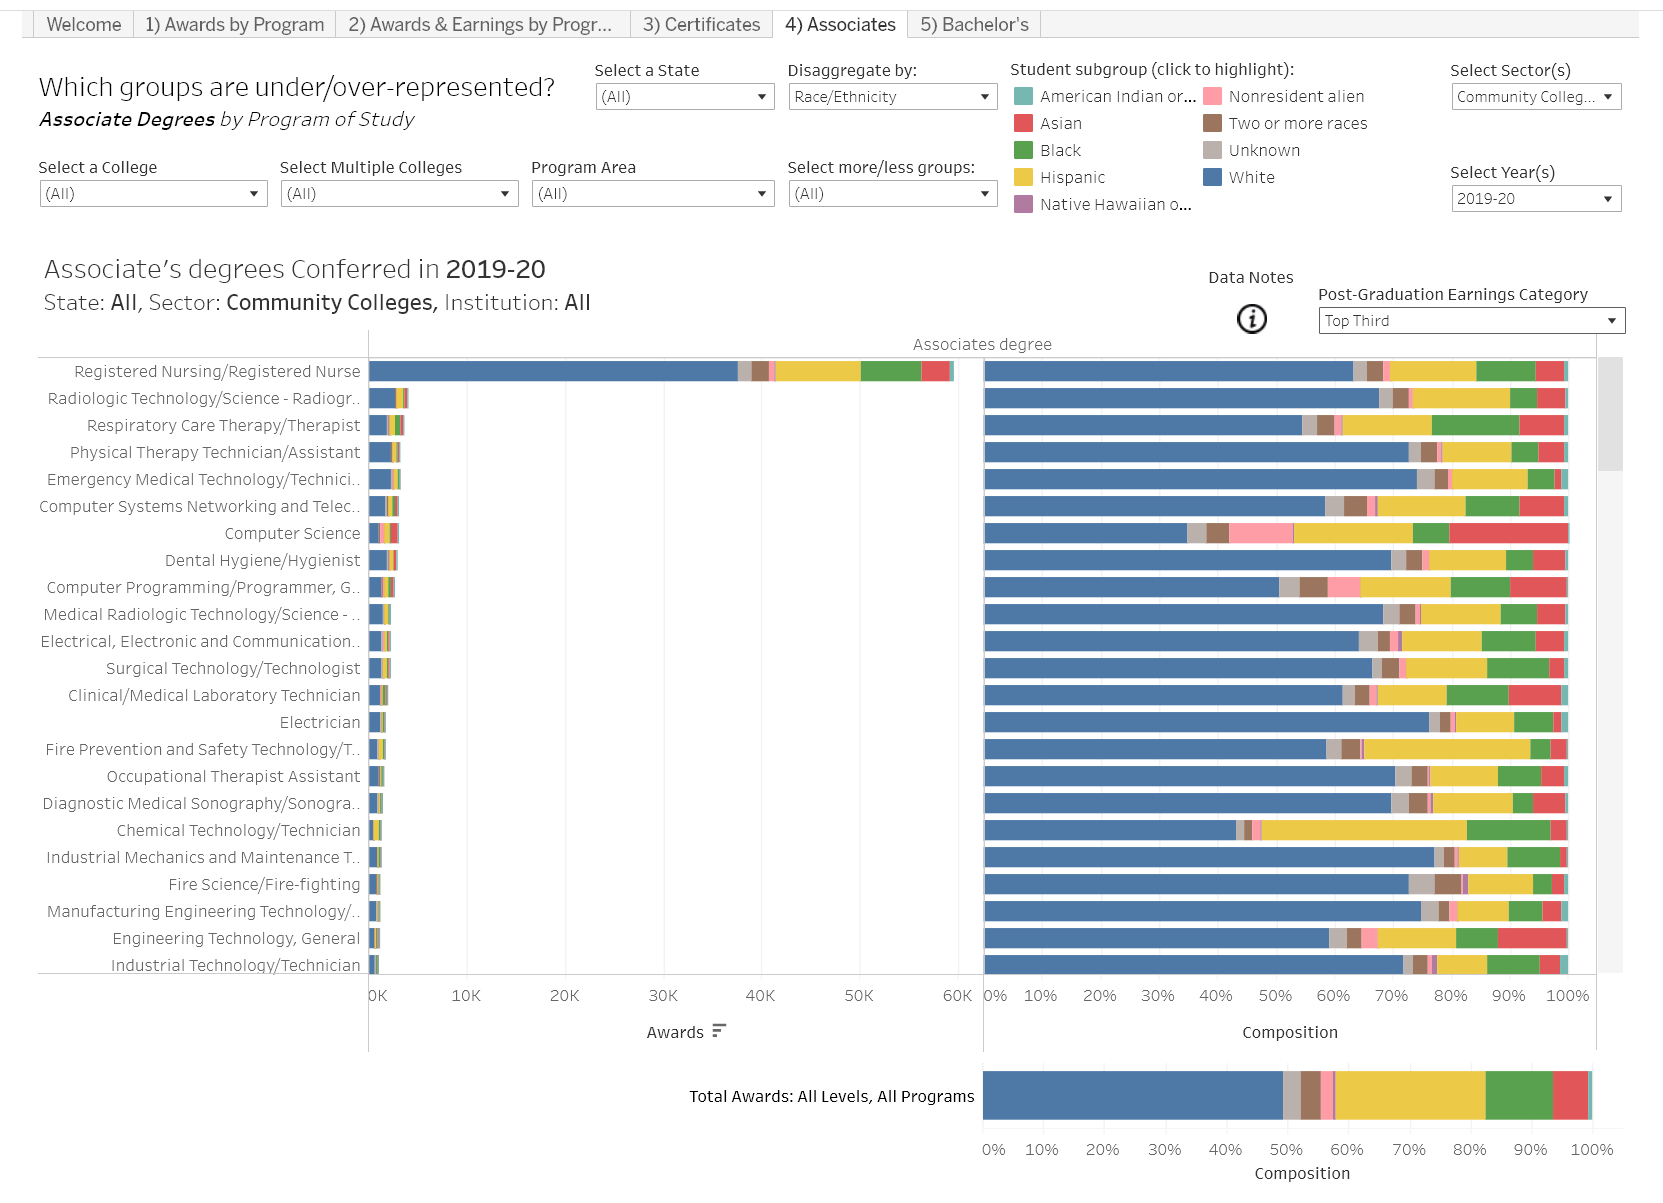
The dashboard makes it possible to disaggregate the three levels of program earnings by student race/ethnicity and/or gender. For example, the view below shows awards with the highest associated postgraduation earnings and allows the user to examine which groups are over- and underrepresented. While White students accounted for half of completions from any community college program, two thirds to three quarters of associate degrees with the highest associated post-graduate earnings were awarded to White students.
While users can examine earnings by program across multiple institutions in a state or nationally, given that earnings even for similar jobs vary considerably across employers and labor markets, the earnings information is probably most meaningful for individual colleges. Also, it is important to note that the College Scorecard earnings data should not be interpreted as providing definitive measures of the economic returns of programs for students or taxpayers. Estimating returns to college programs involves complicated calculations with data on program costs and other information not available in the Scorecard (see, for example, Third Way’s Price-to-Earnings Premium approach). Moreover, wages and economic returns represent an important but incomplete measure of value (for a more comprehensive view, see the Postsecondary Value Commission’s reports).
Still, the data on programs completed and earnings can provide a jumping-off point for motivating and informing discussions across your campus about how to ensure that all students, particularly those from underserved groups, are helped to enter and complete programs that lead to greater opportunity.