Over the past decade, federal data on access to high school dual enrollment coursework have improved substantially, providing both a high-level accounting of the growth of these programs and fine-grained detail on where and for whom they have expanded the most. A notable milestone came last August, when the Integrated Postsecondary Education Data System (IPEDS) released—for the first time—college-level counts of dual enrollment students, disaggregated by race, ethnicity, and gender. But even before this development, the Department of Education’s Civil Rights Data Collection (CRDC) offered extremely useful insights on dual enrollment participation for all public K-12 schools across the country.
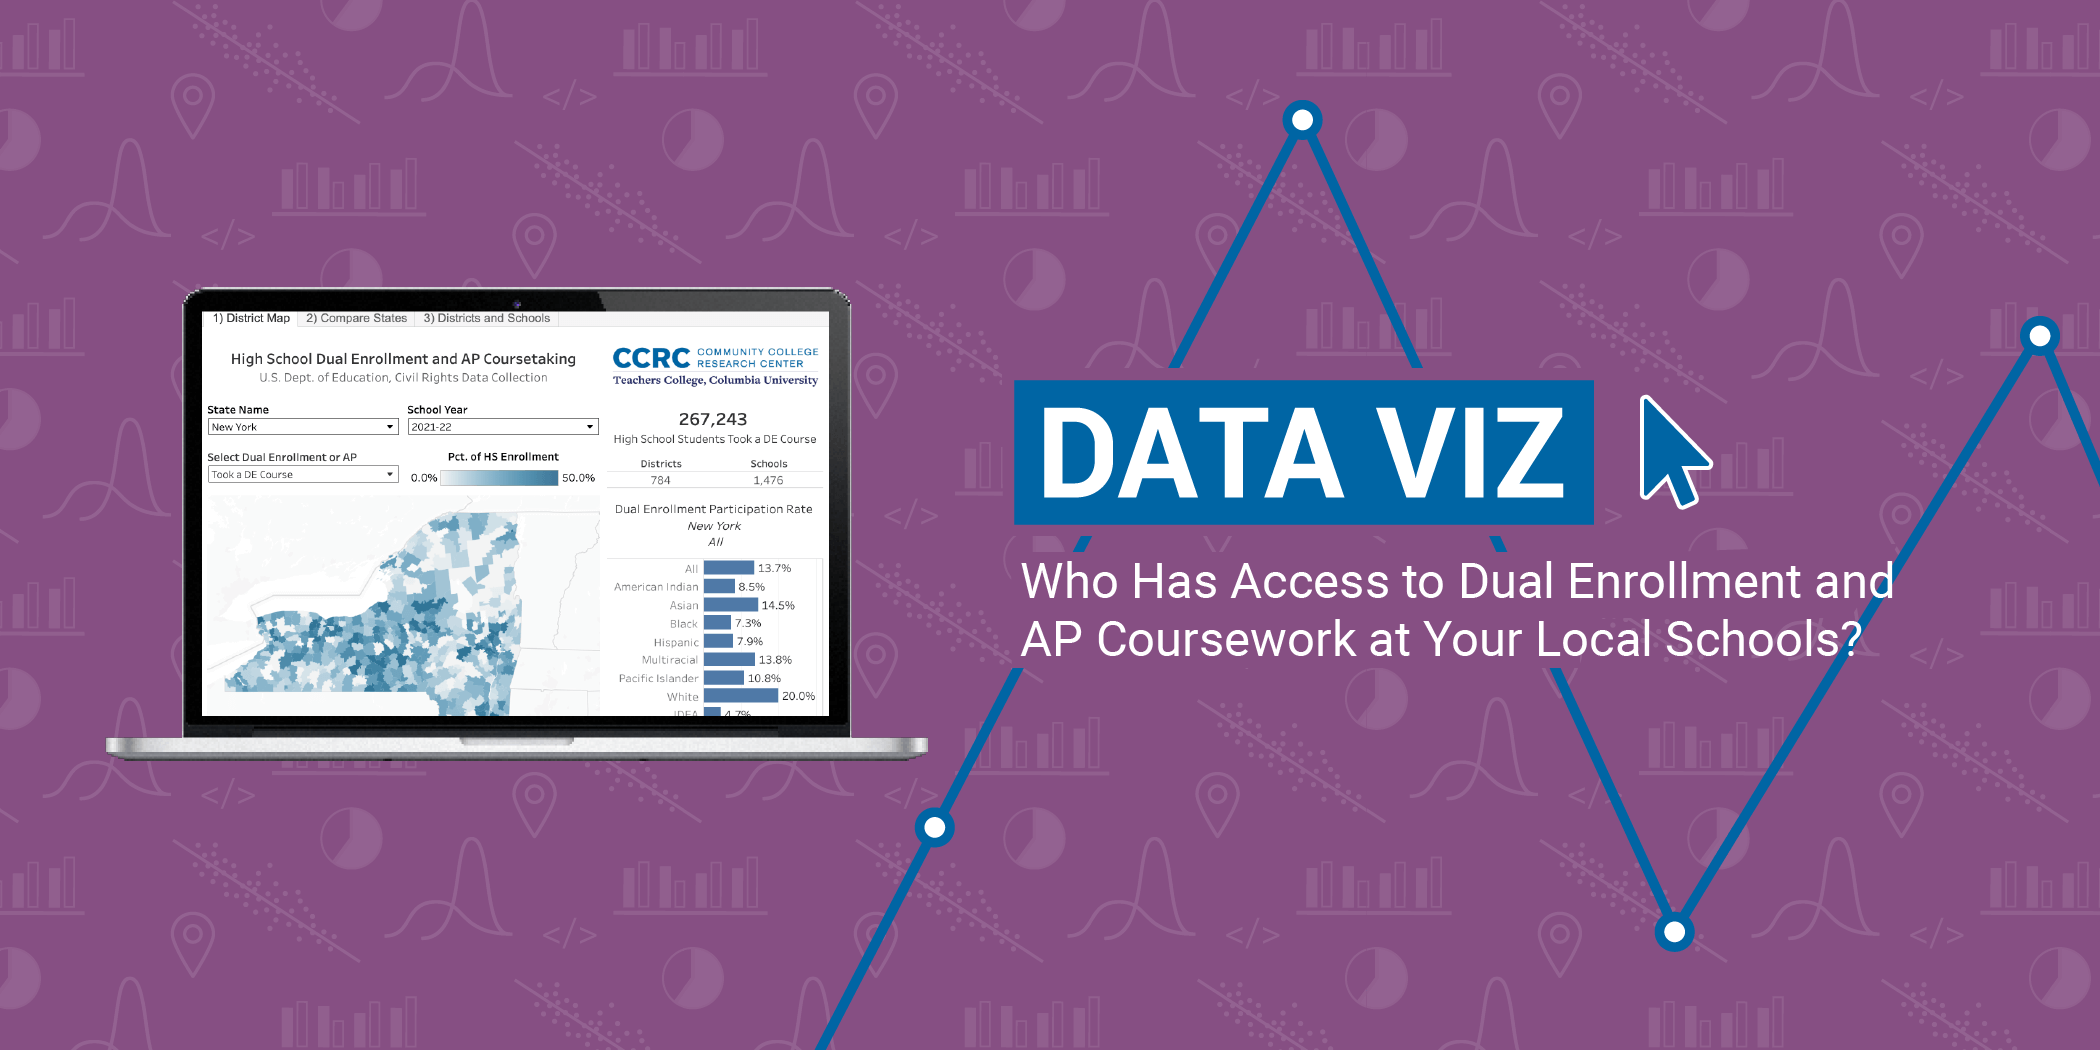
Below is a new interactive dashboard that draws on multiple years of CRDC data to provide a school- and district-level view of dual enrollment and Advanced Placement (AP) access, disaggregated by students’ race/ethnicity, English language learner status (ELL), and disability status (IDEA). The dashboard is meant to help college and K-12 educators as they strengthen dual enrollment programs and expand the number of students who are benefitting from them.
Three Caveats About the Data
Before diving into the dashboard, note that the federal CRDC data have a few limitations.
First, the data—though released just months ago—are somewhat dated. The most recent collection reflects the 2021-22 school year.
Second, some challenges affect the accuracy of the CRDC’s dual enrollment counts. In particular, there have been instances of underreporting by some school districts and states. This may partially explain why the total number of dual enrollment students in the CRDC (1.8 million in 2021-22) is smaller than the number reported in IPEDS (2.5 million in 2022-23). For instance, some K-12 districts may not report dual enrollment students if the course is offered off-site at a partnering college or during the summer.
Third, although this dataset is uniquely comprehensive—covering all public school districts and offering detailed subgroup data—its future availability is uncertain. Cuts to the Department of Education threaten the continuation of large-scale data collection efforts like the CRDC.
Diving In: Mapping Dual Enrollment and AP Participation by District
In the first tab (shown below), you can select your state and see which districts have the highest dual enrollment participation, highlighted in darker blue. This map also displays the total number of dual enrollment students across the state, as well as overall participation rates by student subgroup. You can also toggle between dual enrollment and AP participation rates.
In the table at the bottom, you can look up a specific school district to see its disaggregated participation rates for dual enrollment and AP. Hovering over the map provides an even more fine-grained view, including the top schools in the district by overall enrollment and by participation in dual enrollment or AP.
As you review, consider these two questions:
- Which districts and schools in your region have high or low dual enrollment participation? How does this compare to AP participation?
- Which student groups have high or low participation rates? Have the gaps changed since 2017-18?
Comparing Growth in Dual Enrollment Participation Across States
Tab 2 allows you to track trends in dual enrollment participation over time—both overall and by student subgroup—for your state compared to national averages. For example, dual enrollment participation grew 20 percent from 2017-18 to 2021-22, from 8.6% to 10.3% of high school students taking a dual enrollment course. A table below the line graphs shows these trends across all 50 states.
Comparing Growth in Dual Enrollment Participation Across States
Tab 3 lets you drill down to specific high schools in your selected state. You can sort schools by enrollment size or by dual enrollment or AP participation rates. This view is ideal for identifying both high-participation schools and those with lower participation rates despite having large enrollments and significant numbers of underrepresented students. To identify schools with the greatest opportunity for improving outreach and broadening access, use the filter to show only Title I schools (which serve primarily lower income students).
Strengthening Dual Enrollment as an On-Ramp to College and Career Opportunity
Dual enrollment has grown steadily over the past two decades and now serves 2.5 million students annually. But this growth has not been evenly distributed. Gaps in access—by district, school, and student subgroup—are widespread.
This dashboard is designed to help educators identify where those gaps exist so they can take concrete steps to broaden participation. These school-level data points can be useful to college leaders in that each school displayed has a high school principal who can be contacted or a building that can be visited. These data—available nationally only through the Department of Education’s CRDC—can help both principals and college leaders target outreach efforts to students who are not currently benefitting from dual enrollment but could be.
College leaders aiming to broaden access to dual enrollment can ask the following three questions:
- Which districts and high schools in our service region have the most opportunity for expanding access overall (i.e., larger school enrollments but lower participation) and among specific subgroups we are trying to better serve?
- What have been the biggest barriers to access, and what’s the potential for increasing dual enrollment offerings for these schools and communities?
- What further information is needed (e.g., more recent and local data, testimonials from students or families), and whom from your college or partner high schools and districts do you need to engage with in related discussion and planning?
Dual enrollment is a promising lever for expanding access to college and career opportunity on a large scale, and reforms to realize this potential are achievable and happening across the country. For more resources on how colleges and their K-12 partners have expanded outreach and supported efforts to close gaps in access to dual enrollment courses, see the six partnerships profiled in our DEEP Insights guide (pp. 5–7, 14–16) and findings from the Dual Enrollment Playbook (pp. 20–29).


