


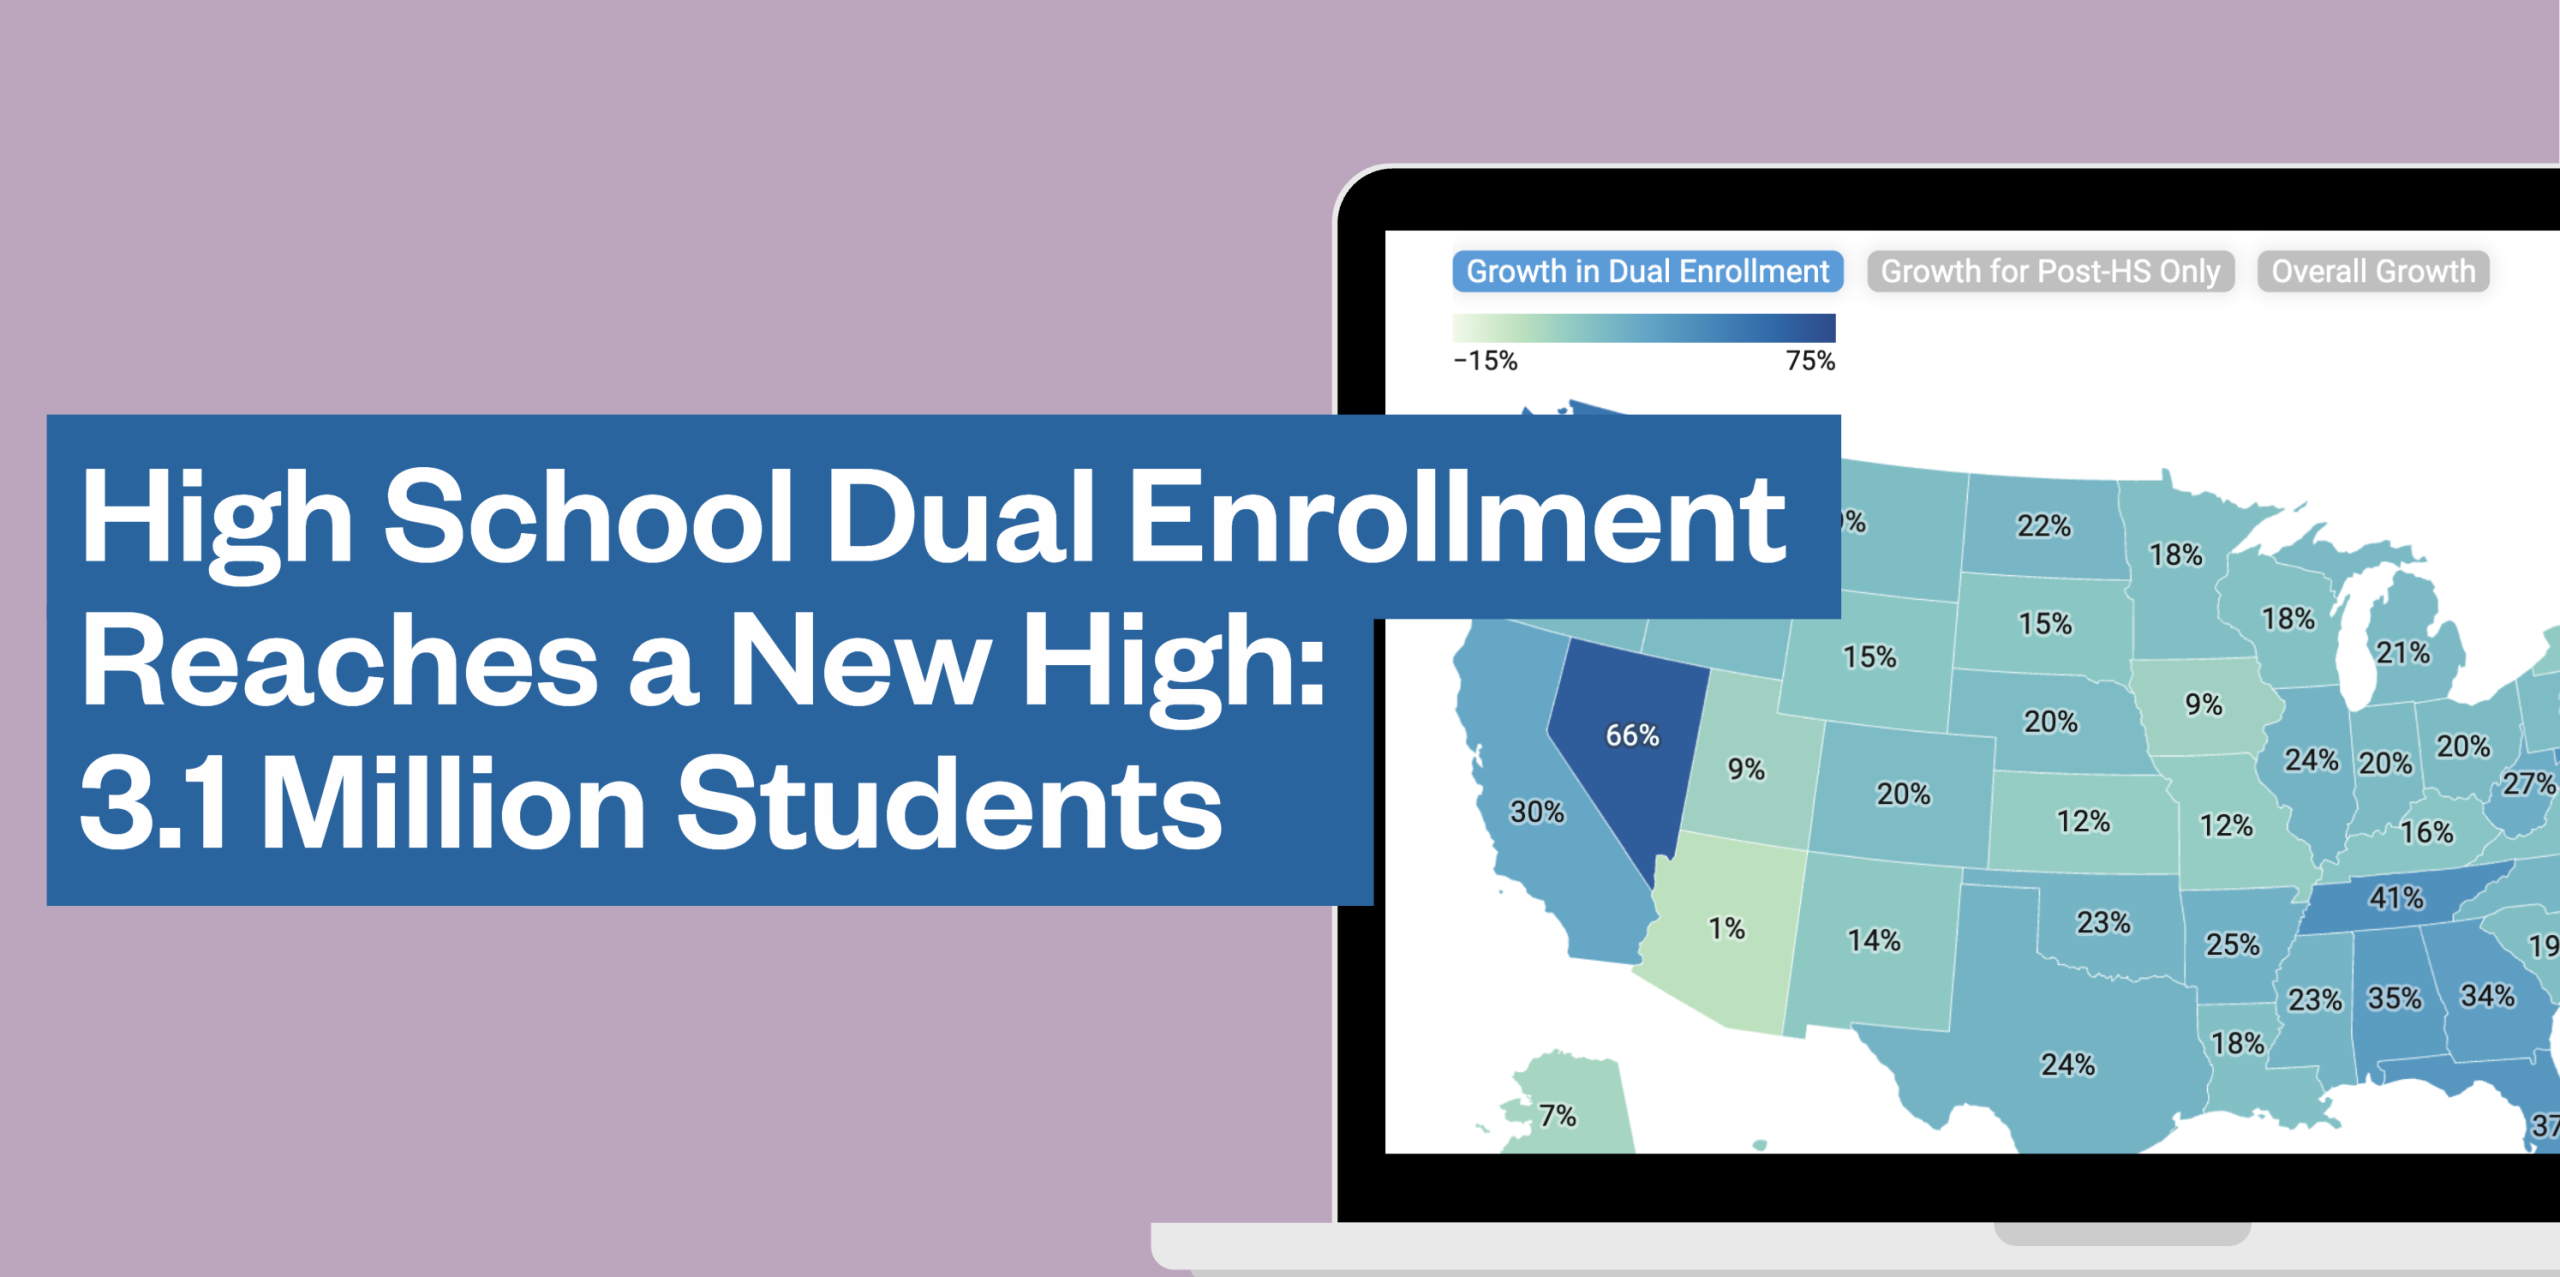
More than 3 million high school students took a college course in 2024–25, according to the third annual release of new dual enrollment data from the U.S. Department of Education’s Integrated Postsecondary Education Data System (IPEDS). This number sets another record: Dual enrollment increased 10% from 2.8 million in 2023–24, and 24% from 2.5 million in 2022–23.
Community colleges, which account for 70% of dual enrollment nationally, served an additional 183,000 dual enrollment students in 2024–25 compared to the year prior (+9%). Over the same period, public four-year colleges, which account for about 1 in 5 dual enrollment students nationally, served 64,000 more dual enrollment students (+12%).
All but four states increased dual enrollment from 2023–24 levels, and every state increased from 2022–23 levels. Seven states grew more than 20% in one year, and nine states grew more than 30% in two years. The most dual enrollment growth from 2022 to 2024 took place in the District of Columbia (+70%), Nevada (+66%), and Washington (+54%). California served some 70,000 additional dual enrollment students from 2022 to 2024, with large gains also occurring in Texas (+60,000) and Florida (+40,000).
Extensive research shows the benefits of taking dual enrollment courses for students’ high school, postsecondary, and earnings outcomes (see this 2024 report for state-by-state findings). Thus, dual enrollment’s growth has great potential to increase postsecondary attainment on a large scale, especially when implemented as an on-ramp to college and career opportunity for students who might not otherwise continue in college after high school.
Yet the new IPEDS data also reveal that several groups of students continue to be underrepresented in dual enrollment. Below are some key takeaways from an initial look at the updated 2024–25 data; to look up results specifically for your college or state, click the link to an updated dashboard below.
Access CCRC’s Dual Enrollment Participation Dashboard to view IPEDS data for your college or state.
How Much of Overall Undergraduate Growth is Driven by Dual Enrollment?
From 2022 to 2024, overall undergraduate enrollment rebounded after pandemic-related declines, growing by 1.6 million to 22.8 million students—an 8% increase. With the exception of Alaska and Vermont, every state increased its total undergraduate enrollment from 2022 to 2024. During that same time, dual enrollment grew 24% from 2.5 million to 3.1 million students, with growth in all 50 states and Washington DC.
In other words, the gain of 600,000 dual enrollment students accounted for 37% of national growth in undergraduate enrollment. In 21 states, the growth of dual enrollment accounted for 50% or more of the total undergraduate enrollment growth. And in five states (Missouri, Montana, Ohio, Pennsylvania, and Wyoming), dual enrollment accounted for 100% of the growth in overall undergraduate enrollment; without dual enrollment, total undergraduate enrollment would have declined.
The increase in dual enrollment from 2022 to 2024 was particularly significant for community colleges, where it grew from 1.8 million to 2.2 million students. The addition of 385,000 dual enrollment students accounted for 42% of the overall increase of 913,000 community college students, bringing total community college enrollment to 9.5 million. The vast majority (86%) of community colleges expanded dual enrollment from 2022 to 2024, including 123 community colleges (14%) that saw declines in post-high school enrollment during the same period.
Four-year institutions have also relied on dual enrollment to maintain and grow overall undergraduate headcounts. Twelve percent of public four-year colleges (63 colleges) and 9% of private nonprofit colleges (65 colleges) increased enrollment from 2022 to 2024 only because of their high school programs. Without dual enrollment gains, enrollment at these institutions would have declined.
Dual Enrollment Now Represents Nearly a Quarter of Community College Students
Dual enrollment accounted for 23% of overall community college enrollment in 2024–25, up slightly but steadily from one and two years prior (22% and 21% in 2023–24 and 2022–23, respectively). As dual enrollment growth outpaces post-high school enrollment growth, high school students make up a larger share of overall enrollment at community colleges.
The precise share of high school students among community college students differs substantially by state (see map below) and is larger in rural areas across states: High school students account for a third of enrollment at rural-serving community colleges compared to a fifth of enrollment at other community colleges.
The map below shows high school dual enrollment as a share of each state’s total community college enrollment in 2024–25. In 25 states, dual enrollment accounted for more than a quarter of community college enrollment, and in 11 states it made up a third or more. In Idaho and Indiana, high schoolers represented the majority of community college students. At 274 community colleges, dual enrollment accounted for more than a third of overall enrollment, including 59 colleges where high school students accounted for more than half of overall enrollment.
Gaps in Dual Enrollment Participation Persist
While dual enrollment continues to expand nationally, there are substantial and sustained gaps in participation across several student groups. For instance, as shown in the chart below, just 8% of dual enrollment students in 2024–25 were Black, well below their representation among K–12 students (15%) and undergraduates overall (13%). Similarly, American Indian, Hispanic, Pacific Islander, and multiracial students were underrepresented in dual enrollment compared to their share of K–12 enrollment—with even larger gaps for young men.
One challenge with IPEDS’s dual enrollment data collection is the large share of students missing race/ethnicity information (9% nationally), which makes this type of comparison less precise. Recently released 2023–24 data from the U.S. Department of Education’s Civil Rights Data Collection (CRDC)—based on information submitted by nearly all public K–12 schools—provide another perspective on underrepresentation in dual enrollment without the missing data issue. The CRDC data include detail on participation by race/ethnicity as well as for English learners and students with disabilities.
The chart below shows trends in dual enrollment participation rates (i.e., the percentage of high school students who took at least one dual enrollment course during the school year) disaggregated by student subgroup. In 2023–24, 12% of high school students were enrolled in a dual enrollment course, but this participation rate was lower for men, for multiracial, Pacific Islander, Hispanic, American Indian, and Black students, and for English learners and students with disabilities. While participation rates for all groups of students have been steadily climbing over time, these gaps between groups persist. Using the chart below, you can view results by state and for specific subgroups.
Strengthening Dual Enrollment Programs and Policies
Given the potential of dual enrollment to increase postsecondary enrollment and completion, particularly for students from underserved communities, its growth can expand college and career opportunity on a large scale. Yet gaps in access are persistent. And limited state funding and investments by colleges and school districts in outreach, advising, quality instruction, and academic supports can prevent programs from fully realizing their potential.
These analyses can help motivate and guide reform efforts by providing public, college- and state-level disaggregated data for practitioners and policymakers seeking to evaluate current programs and policies and plan improvements. As we have learned in our dual enrollment equity pathways research, it is increasingly important—to students, communities, and states alike—to implement dual enrollment as a purposeful on-ramp to college and career opportunity.
Find Your College or State Dual Enrollment Numbers
Use the dashboard below to examine the latest IPEDS data on the number of high school students enrolled at colleges in your state, the share of the overall undergraduate headcount they represent, and students’ racial/ethnic and gender composition.